Nokia Core Monitor and Troubleshooter
Gain clear operational insight to anticipate network behavior and keep cloud native 5G core operations on track
Give operations teams a clearer way to understand what is happening across the cloud native 5G core. Core Monitor & Troubleshooter brings monitoring, data correlation, diagnostics and guided resolution into one operational view, helping teams work faster and with more confidence.
Teams can follow what is happening across core network functions, Kubernetes and the underlying cloud infrastructure from one place, with connected data and guided workflows to support faster decisions.
The product uses open source based observability technologies, enriched with core network specific artefacts such as dashboards, filters, health checks and AI driven analysis models. This turns scattered alarms and logs into a clearer view of network health, service impact and likely root cause.
Key differentiators:
- One operational view across core functions and cloud infrastructure
- AI driven analysis to detect anomalies and support faster root cause identification
- Open architecture based on widely adopted observability technologies
- Guided and automated repair recommendations to reduce manual troubleshooting work
- Subscriber level insight to understand how issues affect users and services
The challenge it solves
Cloud native core networks are more dynamic, distributed and software driven than traditional core environments. Network functions scale up and down, components run across shared cloud infrastructure, and operational data comes from many different layers.
This makes issues harder to see and understand. A service problem may appear as an alarm in one place, a performance deviation somewhere else, and a log pattern in another system. Engineers often need to stitch this data together manually before they can decide what to do.
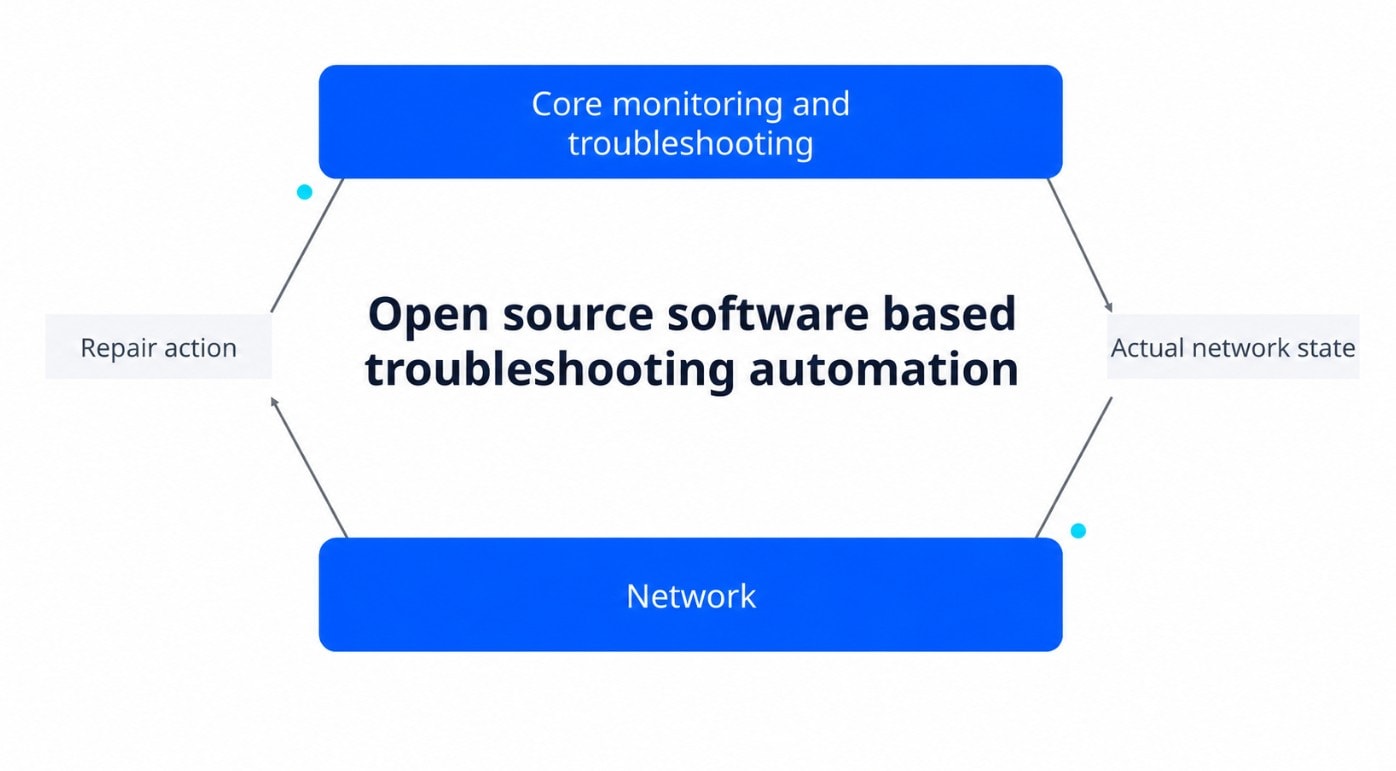
Core Monitor & Troubleshooter addresses this complexity by connecting signals across core functions and cloud layers. It correlates alarms, logs, metrics, traces and health checks, helping teams see the full operational picture instead of isolated symptoms.
As networks move toward higher levels of automation, this visibility becomes essential. Operators need to understand what is happening before they automate actions. Core Monitor & Troubleshooter supports this shift by helping teams move from reactive troubleshooting toward proactive and controlled closed loop operations.
Key benefits
Resolve issues faster
Move from alarm to likely root cause with correlated data, guided workflows and subscriber level visibility. Teams spend less time collecting evidence and more time fixing the issue.
Reduce manual work
Automate repetitive diagnostics, health checks, artefact collection and standard remediation steps. This helps engineers focus on problems that need expert attention.
Improve service stability
Detect anomalies early and understand their potential service impact before they become larger problems. This supports more proactive operations and better network stability.
Increase operational consistency
Use repeatable troubleshooting logic across teams, shifts and domains. This reduces dependency on individual expert knowledge and helps teams work in a more consistent way.
Keep control of automation
Use guided or automated actions where they make sense, while keeping operator oversight where it matters. This enables a gradual, controlled move toward more autonomous operations.
Features and capabilities
Unified monitoring and troubleshooting
Monitor and troubleshoot network health from a single interface. Get a connected view across core functions, Kubernetes and cloud infrastructure, so teams can move from detection to resolution without switching tools.
Data correlation across layers
Link alarms, logs, metrics, traces and health checks into one operational context. This helps turn scattered data into clear insights and faster root cause identification.
AI driven anomaly detection
Identify unusual behavior across performance data, logs and health checks. AI driven analysis helps highlight emerging risks before they affect services.
Subscriber level troubleshooting
Trace and analyze individual sessions across core functions. This helps teams isolate user affecting issues and understand their impact on services.
Guided and automated resolution
Use recommended repair steps, diagnostics and automated responses to shorten recovery time and reduce manual effort.
Open architecture
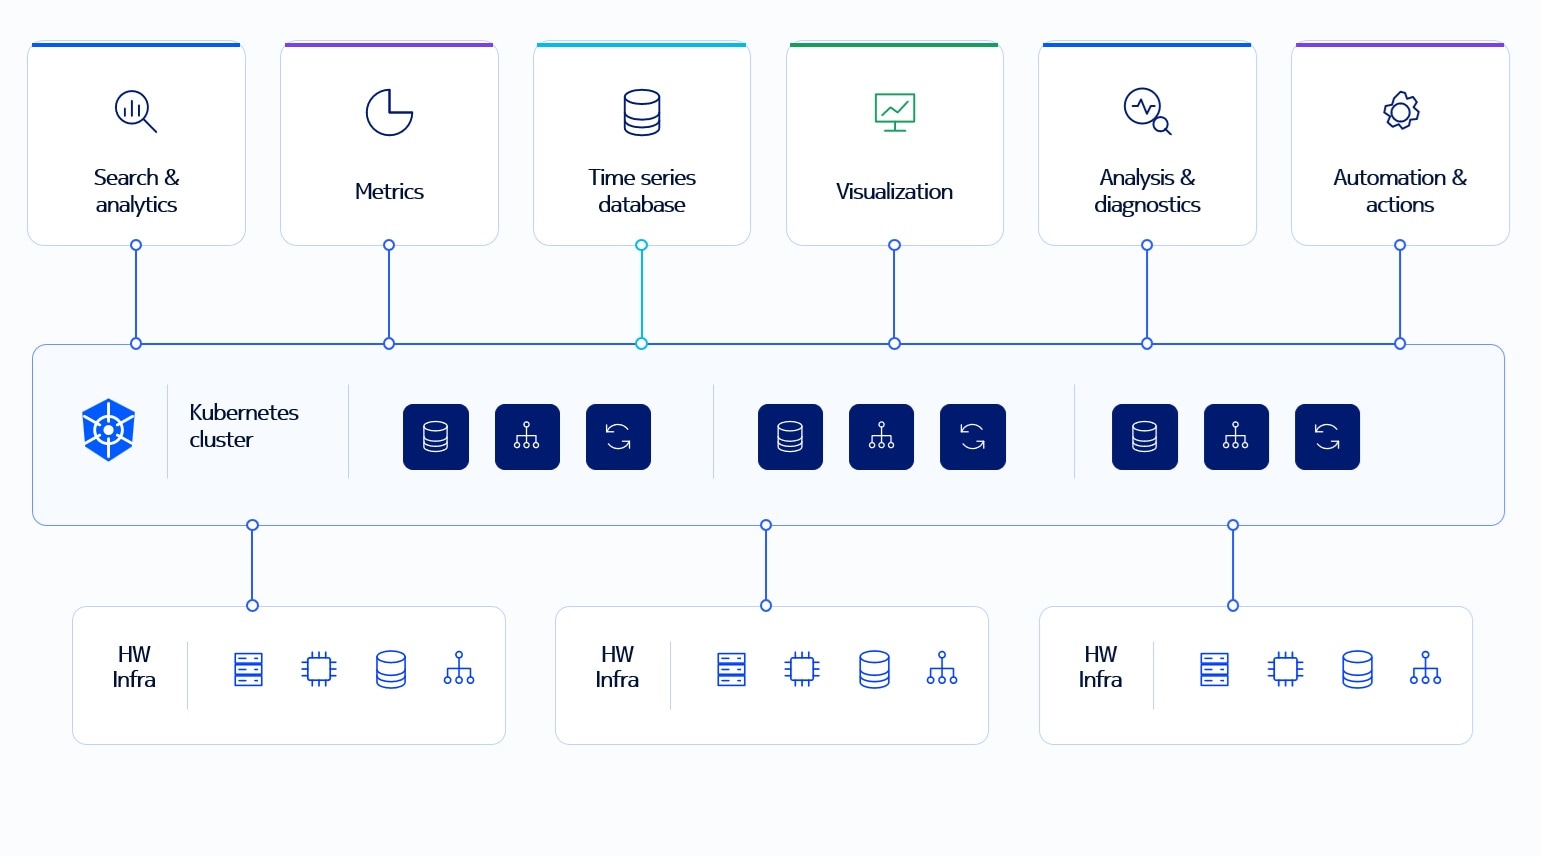
Core Monitor & Troubleshooter uses open interfaces and cloud native principles to collect and process observability data from core functions and infrastructure. It builds on technologies such as Grafana for visualization, VictoriaMetrics for metrics storage, OpenSearch for log analytics and search, and OpenTelemetry based data collection.
Integration with existing operations
The product can share data with external assurance, analytics and ITSM systems through standard interfaces. It is designed to fit into existing operations and evolve as automation maturity grows.
Use cases and applications
Resolve issues across core and cloud layers
Find problems that do not sit in one place. Core Monitor & Troubleshooter connects signals from core functions, Kubernetes and infrastructure to help teams see where an issue starts.
Understand issues down to subscriber level
See what is happening to individual sessions and services. This helps teams isolate user affecting issues without collecting data manually from several systems.
Turn scattered data into a clear root cause
Bring alarms, logs, metrics, traces and health checks into one connected view. Teams can move from many separate symptoms to a clearer explanation.
Detect anomalies before they become bigger problems
Spot unusual behavior early across performance data and health checks. This supports proactive action before service quality is affected.
Make troubleshooting more consistent
Use guided steps and repeatable workflows for common issues. Teams can follow the same logic across shifts and domains.
Reduce manual work with automated diagnostics
Trigger health checks, collect artefacts and start standard workflows from the same environment. This saves time and gives engineers better data for deeper analysis.
Move toward controlled closed loop operations
Use guided or automated repair actions where they make sense, while keeping operator control where it matters. This supports a gradual move from assisted troubleshooting to more autonomous operations.
Technical specifications
Core Monitor & Troubleshooter is a cloud native software product for core network monitoring, troubleshooting and automation.
It collects and correlates operational data from core network functions, Kubernetes clusters and underlying cloud infrastructure. The product supports logs, metrics, traces, alarms, events and health checks, and presents them through dashboards, diagnostics and troubleshooting workflows.
Core architectural elements include:
- Data collection from CNFs, Kubernetes and infrastructure
- Metrics storage using VictoriaMetrics
- Log analytics and search using OpenSearch
- Visualization through Grafana based dashboards
- OpenTelemetry based observability data ingestion
- AI driven analysis of CNF artefacts and operational patterns
- Health checks, filters and troubleshooting models adapted to core network environments
- Interfaces to external assurance, analytics and ITSM systems
- Guided and automated repair recommendations
- Evolution toward closed loop workflows, with lifecycle automation supported by Nokia Cloud Operations Manager
The architecture is designed to support multi vendor environments and to correlate data beyond Nokia domains where standard interfaces and available data allow it.
Related solutions and products
Product
Get the automation, security and performance you need for your cloud platform.
Solution
Make your telco software upgrades so smooth, you won’t even notice
Solution
Avoid complexity and run the voice network efficiently
Product
Create new revenue opportunities and monetize valuable use cases leveraging AI/ML and deep network insights from data analytics.
Product
Automate hybrid cloud lifecycle operations.
Product
How to scale your Policy Control Function for 4G and 5G with the Nokia Policy Controller
Customer success stories

Case study

Customer success

Customer success

Customer success

Customer success

Customer success

Customer success

Customer success

Customer success

Customer success

Customer success

Customer success

Customer success
Video
Nokia Core Talk: How did they do it? DISH, Nokia and the world’s first 5G on AWS’s cloud

case study

Case study

Case study

Video
Telenet Belgium selected Google Anthos & Nokia to deploy their cloud-native 5G Standalone Core

Video
Ooredoo Algeria: transformation towards 5G Core Network (5GC)

Case study
Frequently asked questions
Core Monitor & Troubleshooter is a software product that helps operators monitor, analyze and troubleshoot cloud native core networks from one operational view.
It helps operations teams deal with the complexity of cloud native core networks, where issues may appear across network functions, Kubernetes, infrastructure, logs, metrics, traces and alarms at the same time.
It correlates operational data across layers, provides guided workflows and supports root cause analysis, so teams do not need to manually stitch together data from many tools.
Yes. It uses AI driven analysis to detect anomalies, highlight risks and support faster issue understanding and resolution.
Yes. It uses widely adopted open source based observability technologies such as Grafana, VictoriaMetrics, OpenSearch and OpenTelemetry based data collection.
Yes. It supports guided and automated diagnostics, repair recommendations and a controlled move toward closed loop operations.
Learn more

Blog

Blog

Blog

Blog
Video
Nokia Core Talk: Agility and Efficiency in Multi-Cloud Telecom Networks

Blog

Blog

Blog